
Rain and temperature
Explore rainfall, seasonal patterns, temperature and changes over time for the place you select.
Choose a place, explore local conditions and compare crop plans. The dashboard uses historical data and model estimates where available.
Explore rainfall, seasonal patterns, temperature and changes over time for the place you select.
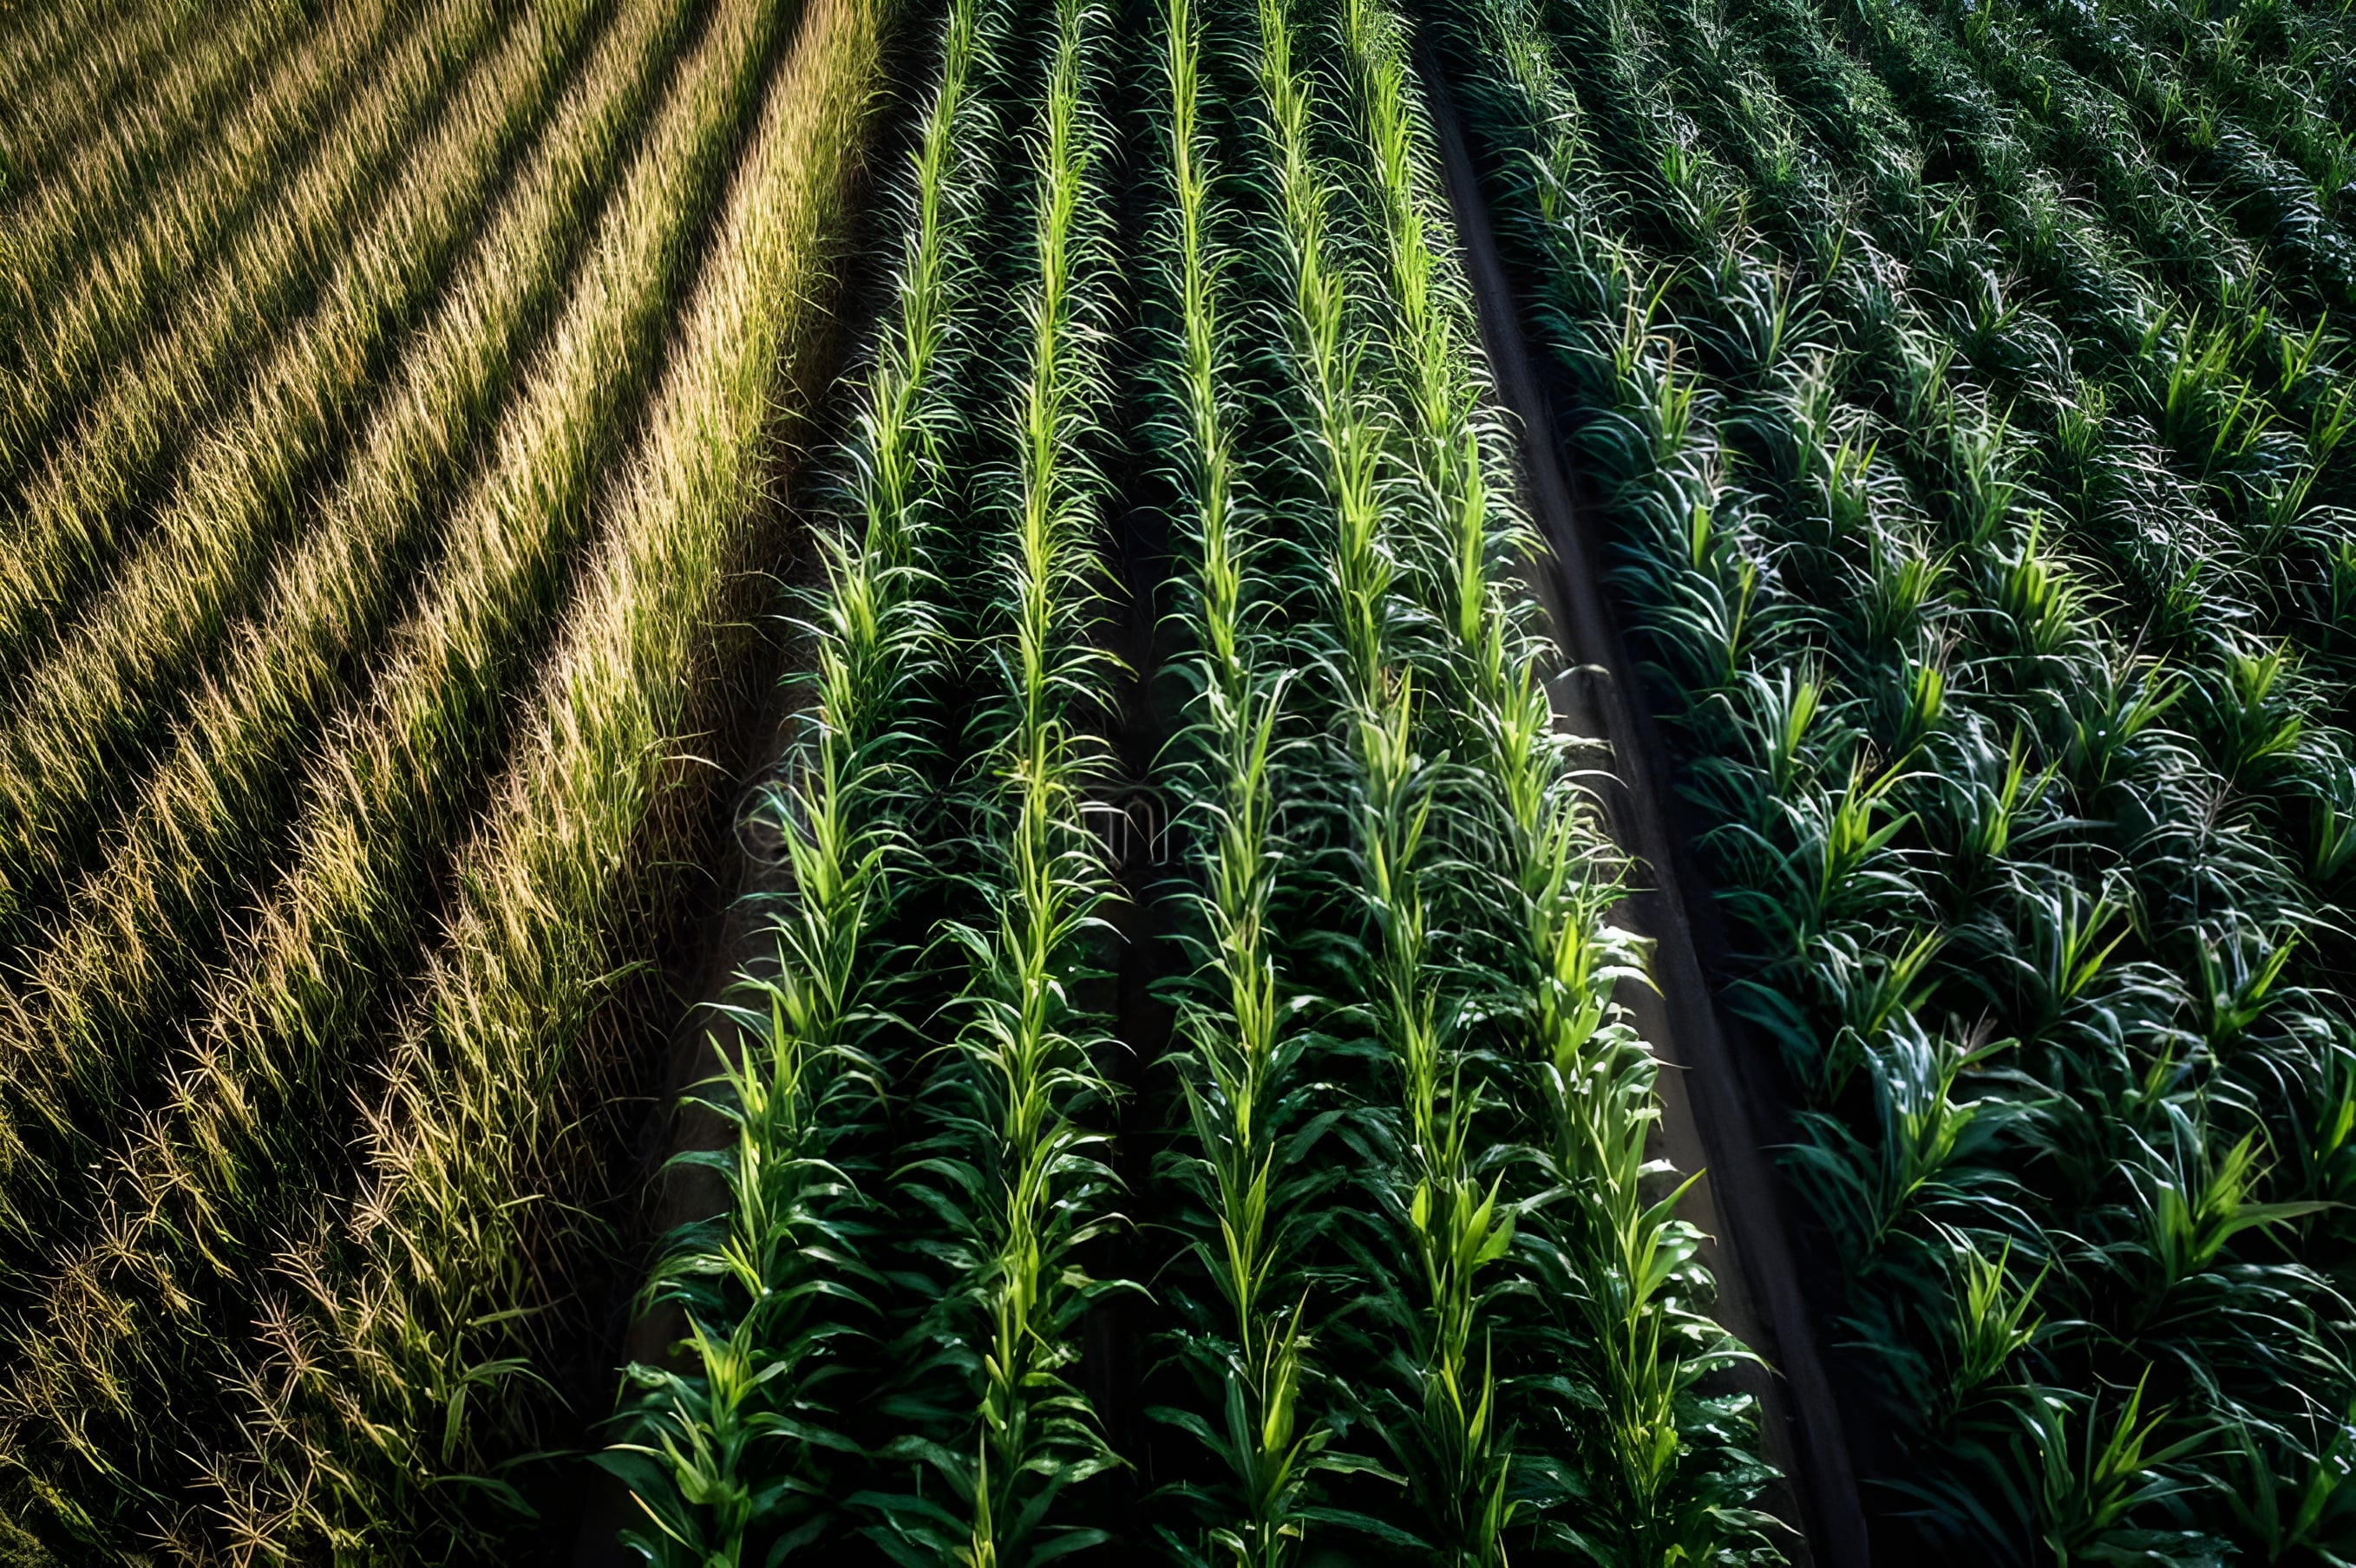
View MODIS vegetation-index history to see how green plant cover has changed across the selected years. These are periodic satellite observations, not live field-camera readings.
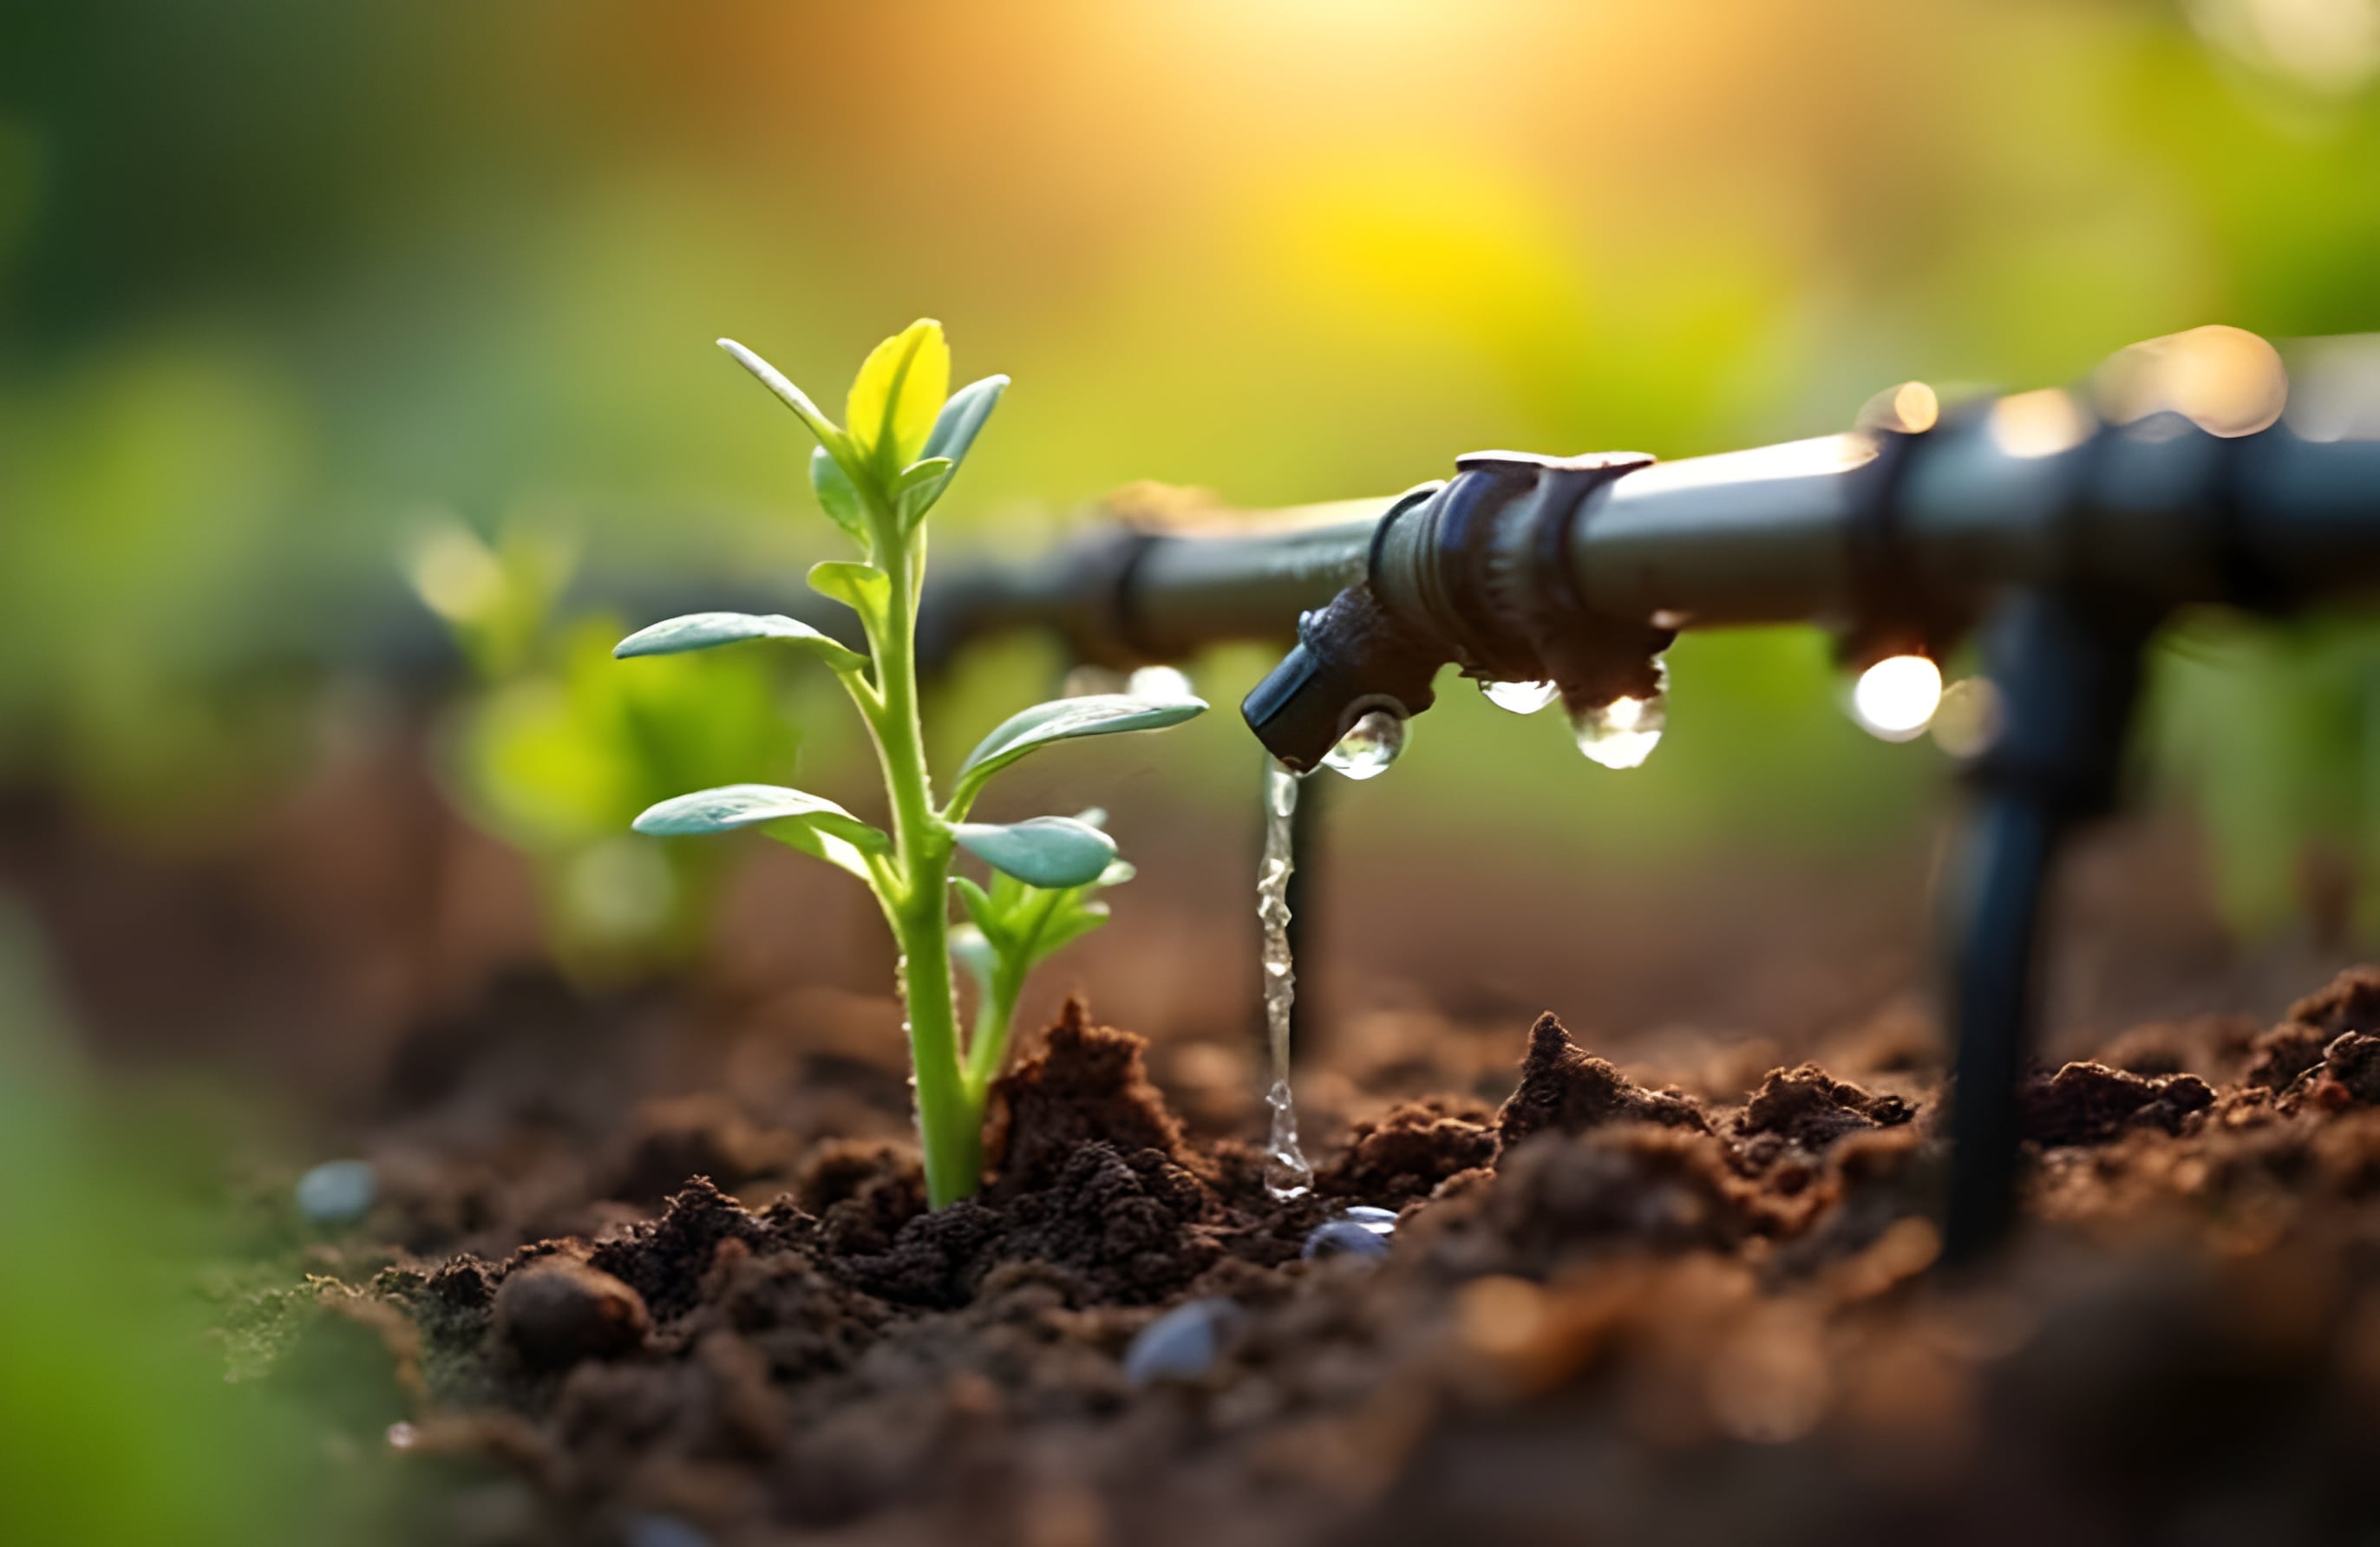
Compare crop sequences using water, soil, growing time, income stability and climate. Review local-fit notes and warnings before making a decision.
Unpredictable weather, depleting groundwater, and tired soil make farming harder every season. Most satellite tools are built for scientists—not the people actually working the land.
Vasundhara brings together NASA POWER climate information, MODIS plant-growth observations and crop-plan comparisons in one place, with notes about estimates and data limits.
You can explore the dashboard without knowing every soil-test value. Add only the details you know.
Search for your village or district, use a nearby town, or pick a point on the map. The dashboard updates for that location.
Check rainfall, temperature, long-term changes and satellite plant-growth history for the years you select.
See how crop plans compare across five checks. Read each warning and ask a local agriculture officer before planting.